Pivot Chart
Structure
The structure of the pivot chart resembles that of the pivot table. This means that all fields defined in the pivot table as line, column and data fields will also be found in the pivot chart.
| Pivot Table | Corresponding Element in the Pivot Chart |
|---|---|
| Line Field | Y-Axis/ Vertical Axis |
| Column Field | X-Axis/ Horizontal Axis |
| Data Field | Graph/ Data Series |
Presentation
In the Chart Type drop-down menu, you can select the manner in which you wish to graphically represent your values. All of the diagram types you know from Excel, such as bar graphs and pie charts, are also available here.
1) Click on the drop-down selection and choose your desired chart type.
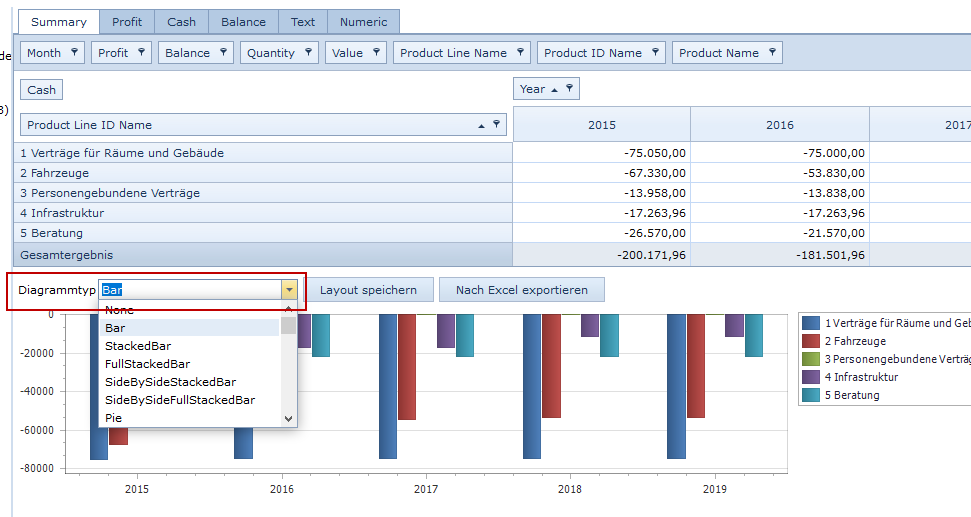
2) The chart will be created as per your selection.
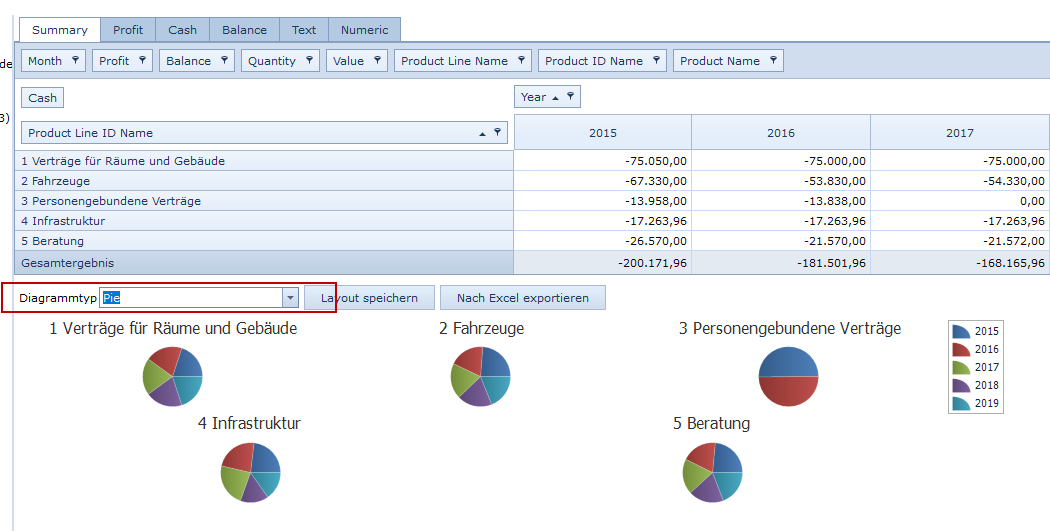
Note: If you move the mouse cursor over the graphs, the values for the graphs will be shown.