Program Settings
In the program settings, you can edit the properties of your tables and matrices, as well as the global zoom factor.
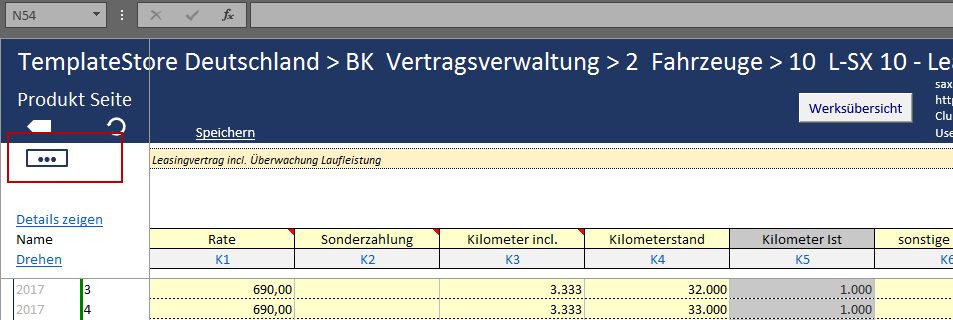
1) Click inside the …-Context menu.
2)Select the Settings option.

3) The Program Settings window will open.
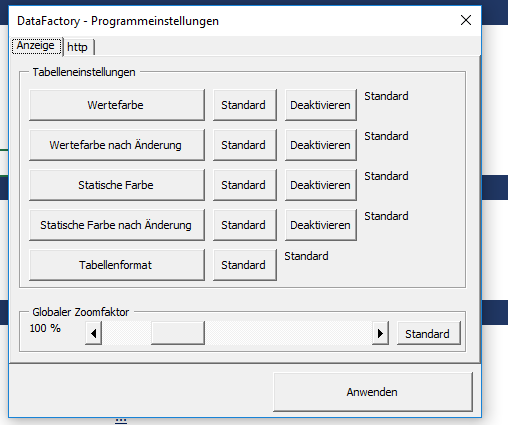
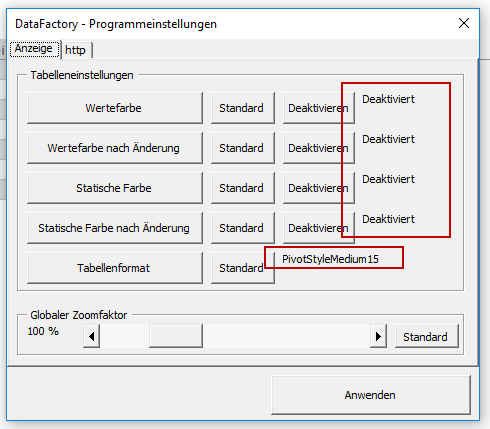
Global Zoom Factor
When presenting data in DataFactory via a projector or in the web, it may be necessary to adjust the display size for your data. You can customize the size in which the interface will be shown via the global zoom factor. The global zoom factor is set to 100% by default.
If you wish to reduce the zoom factor, click on the left arrow. If you wish to increase the zoom factor, click on the right arrow. Alternatively, you can change the zoom factor by moving the slider to the left or right.
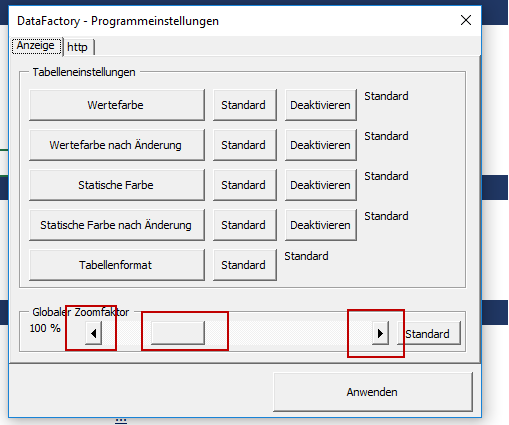
The current zoom factor will be displayed on the left side.

To set the zoom factor back to the default settings, click on the Default button.
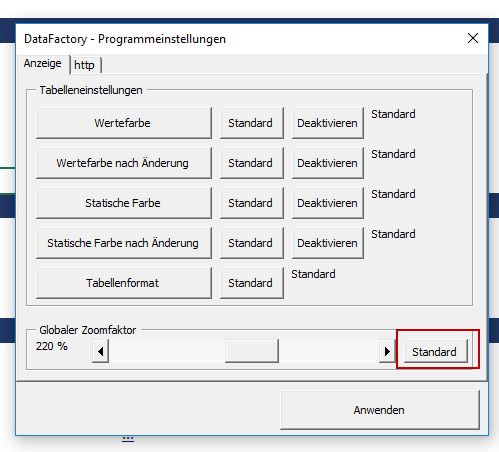
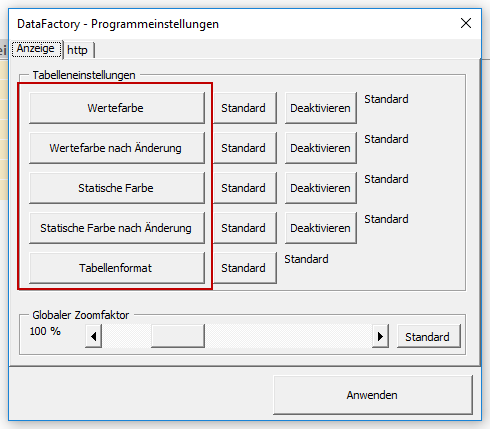
Table Format Settings
In the table settings you can define how the product overview will be shown on the product line level.
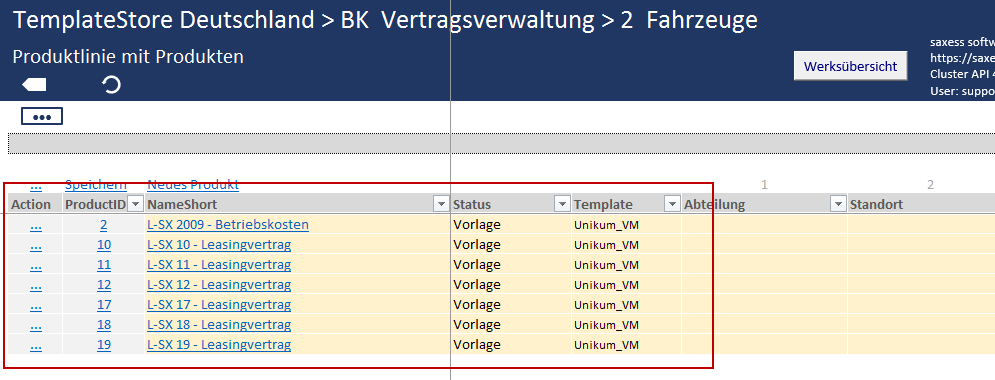
| Table Setting | Description |
|---|---|
| Value Color | Background color of the global attributes, and of the NameShort, Status, and Template columns. |
| Value Color after Changes | Background color of the global attributes, and of the NameShort, Status, and Template columns, after a value has been changed. |
| Static Color | Background color of the Action and ProductID columns. |
| Static Color after Changes | Background color of the Action and ProductID columns after a value has been changed. |
| Table Format | Layout of the table. The available formats correspond to formats offered by Excel. If a new table format is created in Excel, this format will also be available to you in the DataFactory settings. |
If you wish to change the table settings, proceed as follows:
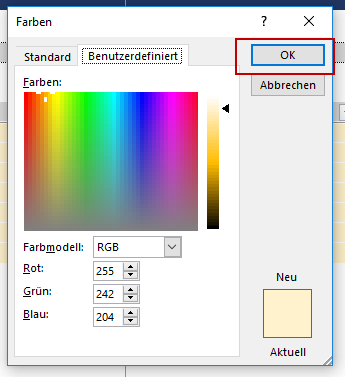
1) Click on the button with the settings you wish to change.
2) Select your desired color in the displayed window and confirm by clicking OK.
3) Your color selection will be displayed on the right side. Click on the Apply button
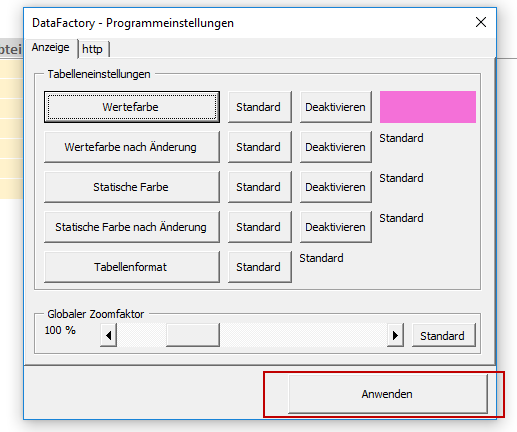
4) Your color selection will be shown.

5) To set the color selection back to the default setting, click on Default and confirm with Apply in the table settings.

Note: It is also possible to deactivate the table settings. To do this, click on the Display tab in the table settings and select Deactivate. Confirm by clicking on Apply.
Alternating the Coloring of Rows
Via the Table Format option you have the ability to use an alternating color scheme on the table rows. To do this, all other table settings must be deactivated and a choice must be selected in the table format section.
Matrix Settings
In the matrix settings, you can choose whether changed values will be highlighted, and if so, in what manner. To do this, simply select the checkboxes with your desired options in the tab Display 2.
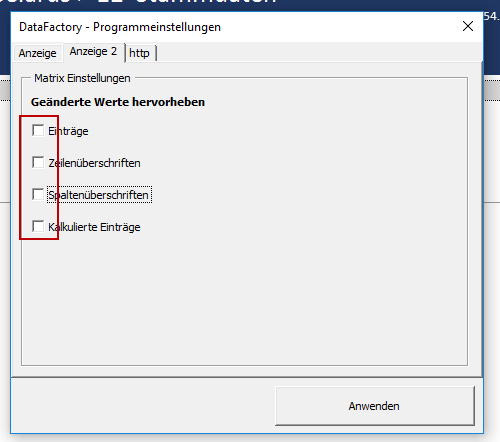
The following highlighting options are available:
| Setting | Description |
|---|---|
| Entries | New or changed value entries will be highlighted. |
| Row Titles | New or changed row titles will be highlighted. |
| Column Titles | New or changed column titles will be highlighted. |
| Calculated Entries | Cells that contain formulas and calculate new values through a change in their related data will be highlighted. |